Fig. 1
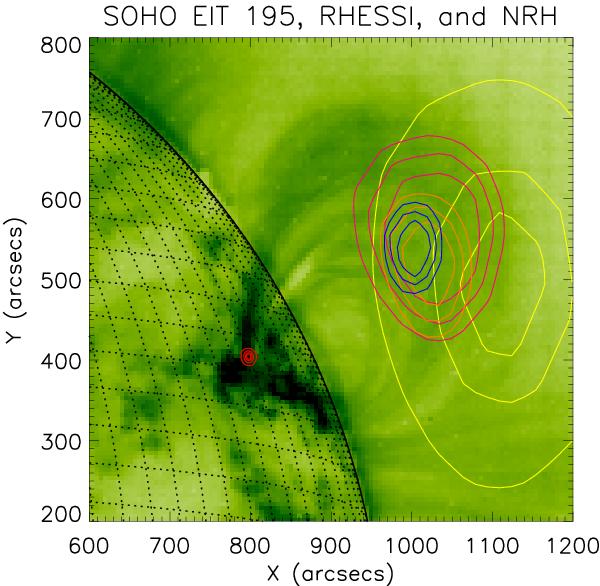
The morphology of the April 15, 2002 solar flare. Background is SOHO/EIT 195 image. The small red contour lines at the base of the plasma loops on the left correspond to HXR photons imaged by RHESSI in the 15 − 30 keV range. The large contours on the right hand side correspond to NRH radio images at frequencies 432 MHz (blue), 327 MHz (orange), 236 MHz (pink), 164 MHz (yellow).
Current usage metrics show cumulative count of Article Views (full-text article views including HTML views, PDF and ePub downloads, according to the available data) and Abstracts Views on Vision4Press platform.
Data correspond to usage on the plateform after 2015. The current usage metrics is available 48-96 hours after online publication and is updated daily on week days.
Initial download of the metrics may take a while.