Fig. 8
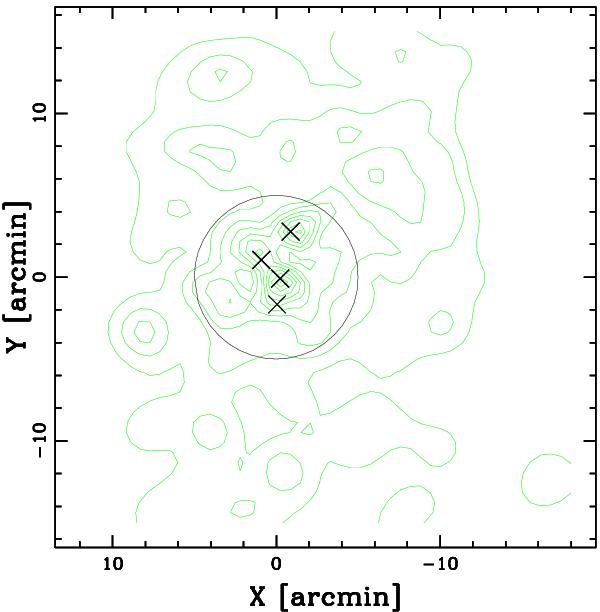
Spatial distribution on the sky and relative isodensity contour map of likely cluster members with r′ ≤ 20, obtained with the 2D DEDICA method. The large faint circle indicate the region of 5′-radius which is sampled by the spectroscopic data. The crosses indicate the position of the peaks in the distribution of the spectroscopic members.
Current usage metrics show cumulative count of Article Views (full-text article views including HTML views, PDF and ePub downloads, according to the available data) and Abstracts Views on Vision4Press platform.
Data correspond to usage on the plateform after 2015. The current usage metrics is available 48-96 hours after online publication and is updated daily on week days.
Initial download of the metrics may take a while.