Fig. 7
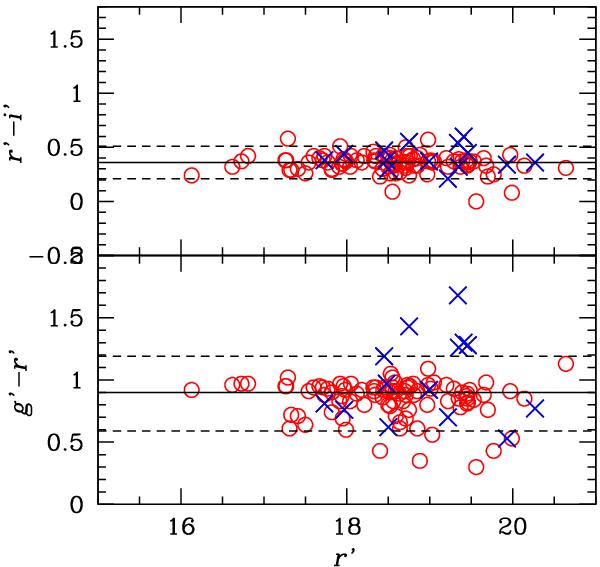
Upper panel: r′ − i′ vs. r′ diagram for galaxies with available spectroscopy. Red circles and blue crosses indicate cluster members and non members. The solid line gives the median color determined on member galaxies; the dashed lines are drawn at ± 0.15 mag from this value. Lower panel: g′ − r′ vs. r′ diagram for galaxies with available spectroscopy. The dashed lines are drawn at ± 0.3 mag from the median value determined on member galaxies.
Current usage metrics show cumulative count of Article Views (full-text article views including HTML views, PDF and ePub downloads, according to the available data) and Abstracts Views on Vision4Press platform.
Data correspond to usage on the plateform after 2015. The current usage metrics is available 48-96 hours after online publication and is updated daily on week days.
Initial download of the metrics may take a while.