Fig. 6
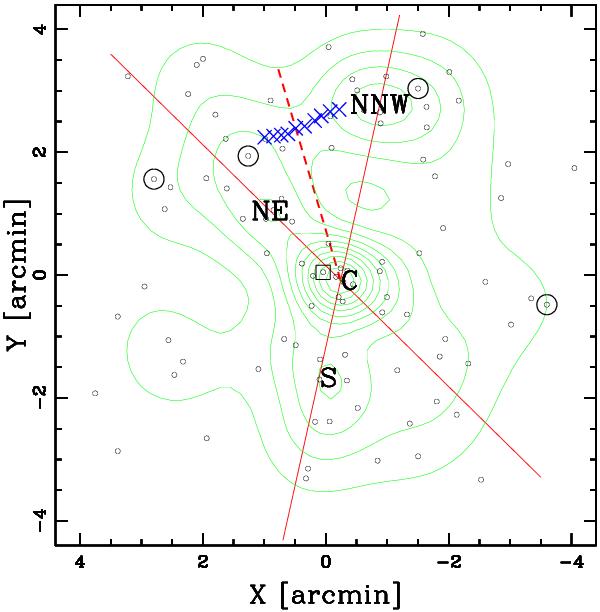
Spatial distribution on the sky and relative isodensity contour map of spectroscopic cluster members, obtained with the 2D DEDICA method. The X-ray peak is taken as the cluster center. The location of the four brightest galaxies are indicated by large circles. The square indicates the central luminous galaxy CBCG. The four significant peaks are labelled. The two (red) solid slides and the dashed line indicate the two likely merging directions and their bisecting, respectively. Blue crosses indicate, in a schematic way, the sharp discontinuity detected in the X-ray surface brightness (see Sect. 4 for details).
Current usage metrics show cumulative count of Article Views (full-text article views including HTML views, PDF and ePub downloads, according to the available data) and Abstracts Views on Vision4Press platform.
Data correspond to usage on the plateform after 2015. The current usage metrics is available 48-96 hours after online publication and is updated daily on week days.
Initial download of the metrics may take a while.