Fig. 5
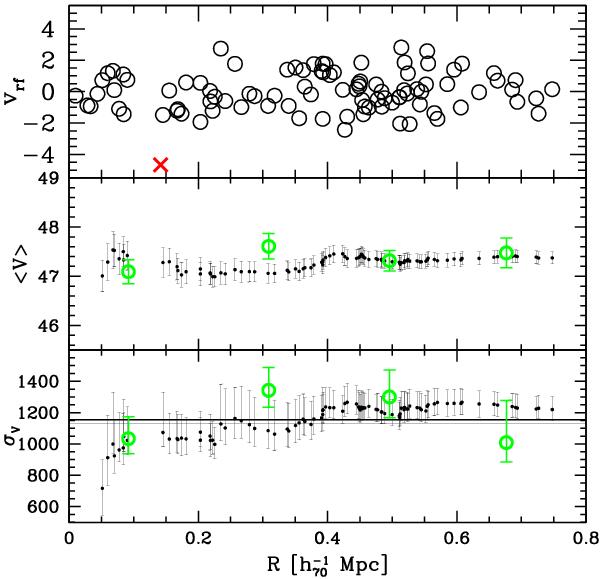
Top panel: rest-frame velocity vs. projected distance from the cluster center of cluster members (circles). The red cross indicates the galaxy rejected by the “shifting gapper” selection procedure. Middle and bottom panels: differential (big circles) and integral (small points) profiles of mean velocity and LOS velocity dispersion, respectively. For the differential profiles, we plot the values for four annuli from the center of the cluster, each of 0.2  Mpc(large green symbols). For the integral profiles, the mean and dispersion at a given (projected) radius from the cluster-center is estimated by considering all galaxies within that radius – the first value computed on the five galaxies closest to the center. The error bands at the 68% c.l. are also shown. In the lower panel, the horizontal line represents the X-ray temperature with the respective errors transformed in σV assuming the density-energy equipartition between ICM and galaxies, i.e. βspec = 1 (see Sect. 5).
Current usage metrics show cumulative count of Article Views (full-text article views including HTML views, PDF and ePub downloads, according to the available data) and Abstracts Views on Vision4Press platform.
Data correspond to usage on the plateform after 2015. The current usage metrics is available 48-96 hours after online publication and is updated daily on week days.
Initial download of the metrics may take a while.