Fig. 10
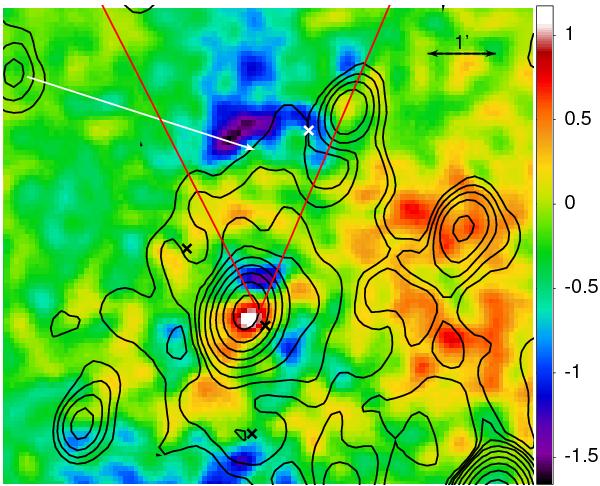
Residuals of the X-ray surface brightness map after subtraction of the best fitting elliptical beta model (the colors correspond to the deviations in sigma to the surface brightness profile for each pixel). The black contours show the extended radio emission (Bacchi et al. 2003). The arrow indicates the position of the North surface brightness jump. The two red lines show the 70–120 deg sector used to produce the profile plotted in Fig. 11. Crosses show the positions of the peaks in the distribution of the optical spectroscopic members as in Figs. 8, and 9.
Current usage metrics show cumulative count of Article Views (full-text article views including HTML views, PDF and ePub downloads, according to the available data) and Abstracts Views on Vision4Press platform.
Data correspond to usage on the plateform after 2015. The current usage metrics is available 48-96 hours after online publication and is updated daily on week days.
Initial download of the metrics may take a while.