Fig. 1
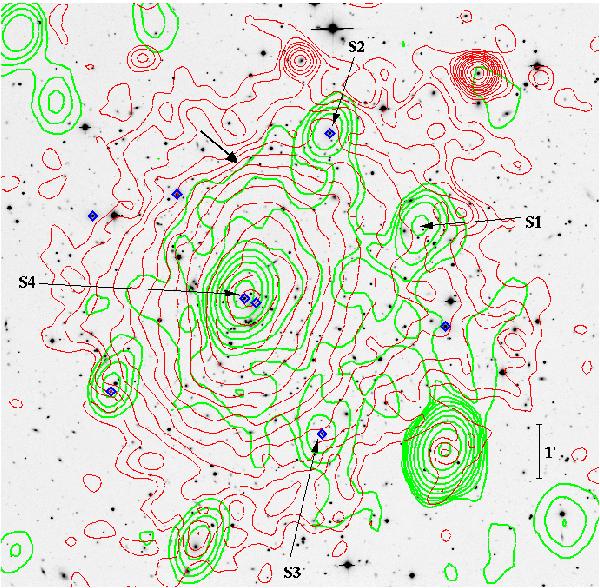
INT r′-band image of the cluster A545 (north at the top and east to the left) with, superimposed, the contour levels of the XMM archival image (ID. 0304750101) in the 0.4–2 keV energy range (thin/red contours) and the contour levels of a VLA radio image at 1.4 GHz (thick/green contours, see Bacchi et al. 2003). Blue rotate squares highlight the positions of bright galaxies cited in the text. Labels S1, S2, S3 and S4 indicate the positions of radio sources listed by Bacchi et al. In particular, the galaxy indicated by “S4” is the brightest galaxy in the cluster central region (CBCG). In the northern region, an arrow highlights a sharp discontinuity in the X-ray surface brightness (see text).
Current usage metrics show cumulative count of Article Views (full-text article views including HTML views, PDF and ePub downloads, according to the available data) and Abstracts Views on Vision4Press platform.
Data correspond to usage on the plateform after 2015. The current usage metrics is available 48-96 hours after online publication and is updated daily on week days.
Initial download of the metrics may take a while.