Fig. 3
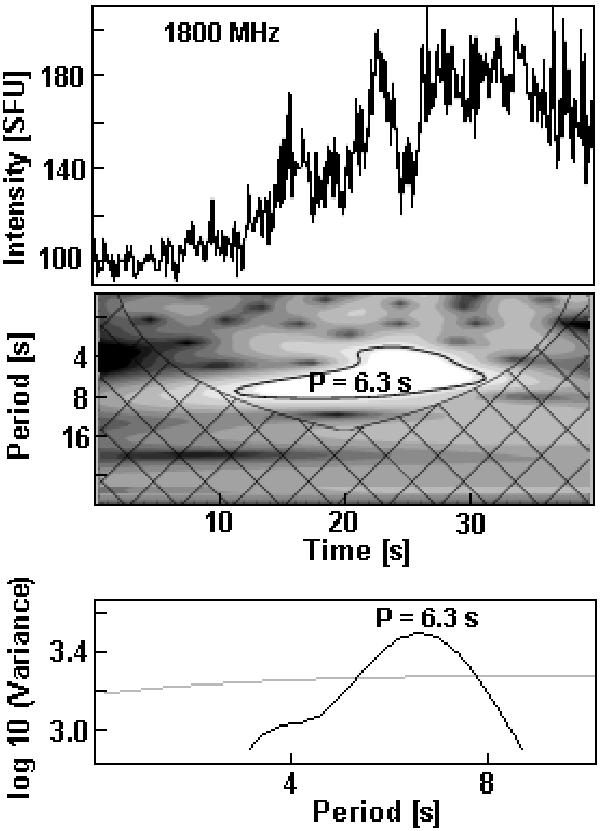
Typical example of the tadpole detected at the radio frequency 1800 MHz in the interval T (see Fig. 1). Upper panel shows original time series (2003 August 5 event). Middle panel shows its wavelet power spectrum with the tadpole pattern (characteristic period P = 6.3 s) outlined by a contour at the 99% confidence level. Bottom panel shows the global wavelet spectrum (black line) with the maximum for the period P = 6.3 s. The gray line means the 99% significance level.
Current usage metrics show cumulative count of Article Views (full-text article views including HTML views, PDF and ePub downloads, according to the available data) and Abstracts Views on Vision4Press platform.
Data correspond to usage on the plateform after 2015. The current usage metrics is available 48-96 hours after online publication and is updated daily on week days.
Initial download of the metrics may take a while.