Fig. 3
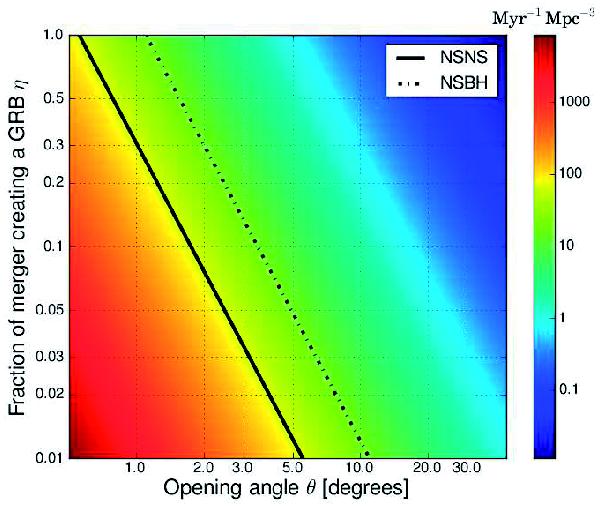
Plot of the rate for model “delay power”, which yields the minimum rate (see Appendix B), as a function of the GRB opening angle θ and the parameter η. The other parameters are kept constant as they are more reliable. The color show the rate in units of Myr-1 Mpc-3, and the black lines delineate the areas excluded by GW upper limits in the case of NS-NS and NS-BH binaries (LIGO Scientific Collaboration and Virgo Collaboration 2010b); the lower left areas are excluded.
Current usage metrics show cumulative count of Article Views (full-text article views including HTML views, PDF and ePub downloads, according to the available data) and Abstracts Views on Vision4Press platform.
Data correspond to usage on the plateform after 2015. The current usage metrics is available 48-96 hours after online publication and is updated daily on week days.
Initial download of the metrics may take a while.