Free Access
Fig. 2
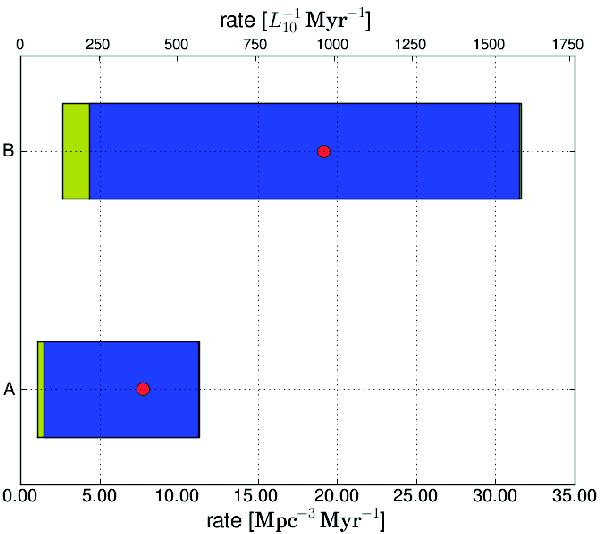
Ranges of the computed rates using dataset “A” with only the reliable redshift values and dataset “B” with both the reliable and probable redshift values. The red dot indicates the median value, the blue bar the 20% to 80% quantile range, while the yellow bar covers the total rate range.
Current usage metrics show cumulative count of Article Views (full-text article views including HTML views, PDF and ePub downloads, according to the available data) and Abstracts Views on Vision4Press platform.
Data correspond to usage on the plateform after 2015. The current usage metrics is available 48-96 hours after online publication and is updated daily on week days.
Initial download of the metrics may take a while.