Fig. 2
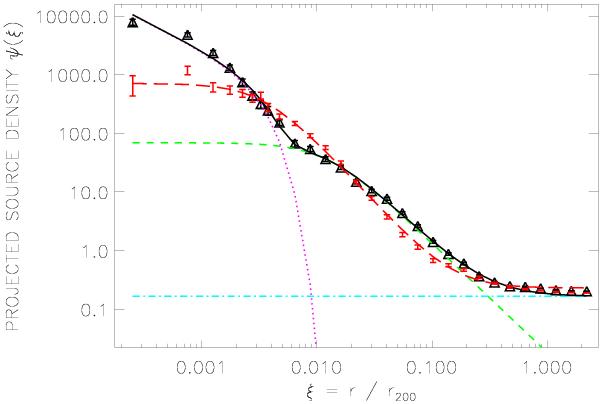
Radial distribution of 1.4 GHz radio sources brighter than 5 mJy in the maxBCG cluster sample. The normalization on the y-axis is arbitrary. Radio sources selected from the FIRST catalog (triangles with error bars) clearly indicate three components: a narrow central peak, fitted with a Gaussian (dotted line); a broader distribution of sources, fitted with a β-profile (short-dashed line) and a background/foreground component (dash-dotted line). The sum of the components is indicated by the solid line. The radial profile derived from the NVSS catalog is indicated by the error bars without symbols. The fit to these data (red long-dashed line) does not include a Gaussian component.
Current usage metrics show cumulative count of Article Views (full-text article views including HTML views, PDF and ePub downloads, according to the available data) and Abstracts Views on Vision4Press platform.
Data correspond to usage on the plateform after 2015. The current usage metrics is available 48-96 hours after online publication and is updated daily on week days.
Initial download of the metrics may take a while.