Fig. 5
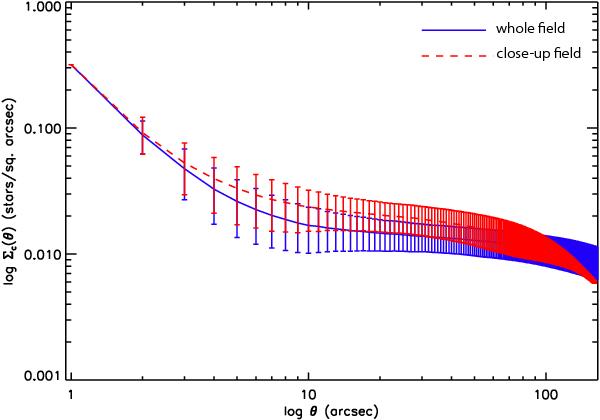
Average surface density of stellar companions as a function of projected angular separation from each blue star in the whole observed area (blue solid line) and in the region of the vicinity of the H ii region N33 (red dashed line). Error bars are indicated. From both curves, one can distinguish a break in the correlation at almost the same separation of θ ≃ 10″, i.e., 3 pc. This scale separates any large stellar clustering from the small binary/multiple stellar clumps.
Current usage metrics show cumulative count of Article Views (full-text article views including HTML views, PDF and ePub downloads, according to the available data) and Abstracts Views on Vision4Press platform.
Data correspond to usage on the plateform after 2015. The current usage metrics is available 48-96 hours after online publication and is updated daily on week days.
Initial download of the metrics may take a while.