Fig. 4
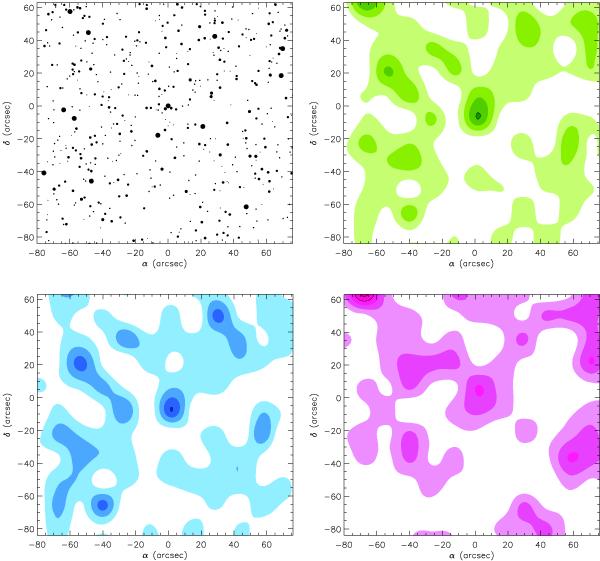
Isodensity contour maps constructed to search for stellar clustering around the compact SMC H ii region N33. In the top-left panel, the stellar map for the close-up field of view centered on N33 (position 0, 0). The stellar density maps refer to the same close-up field of N33. They are shown as they are constructed for all observed stars (green map, top-right panel), for blue (main sequence) stars (blue map, bottom-left panel), and red evolved stars (red contour map, bottom-right panel). Isopleths are plotted starting at the average background stellar density and in steps of σ above this level. No stellar concentration with density ≥3σ above the background is identified in the maps. Only the central part of the small stellar clump encircling N33 in the green and blue maps reaches the 3σ density level.
Current usage metrics show cumulative count of Article Views (full-text article views including HTML views, PDF and ePub downloads, according to the available data) and Abstracts Views on Vision4Press platform.
Data correspond to usage on the plateform after 2015. The current usage metrics is available 48-96 hours after online publication and is updated daily on week days.
Initial download of the metrics may take a while.