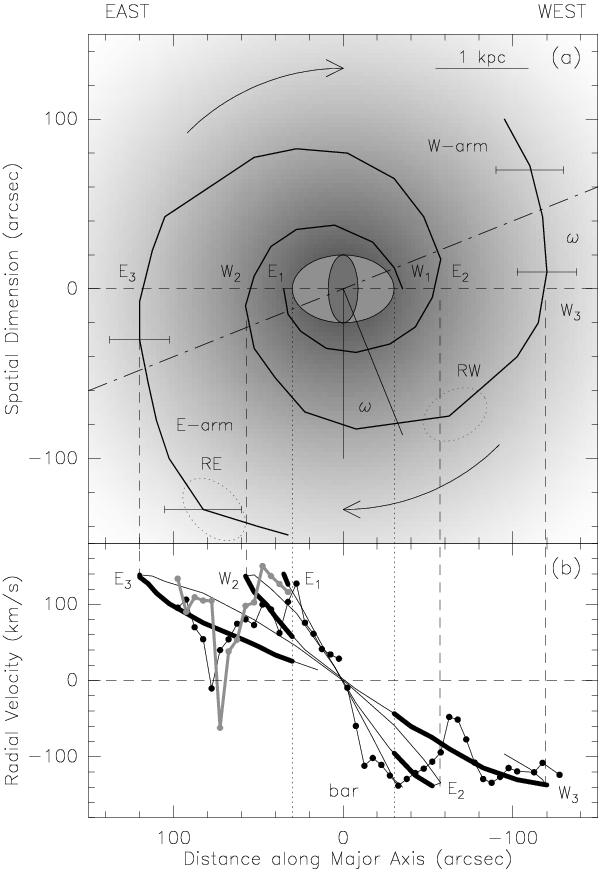
Fig. 8

Schematic view of M 82’s structure a), as explained in Fig. 6. b) p − v diagram showing the radial velocities of the spiral arms projected along the spectrograph slit. Thin lines: line-of-sight radial velocities of the eastern and western spiral arms; heavy lines: line-of-sight radial velocities of the eastern and western spiral arm sections at the front of the galaxy (i.e. either in front of the dashed line or the dashed-dotted line). Dots on western side: ionized gas [S ii], [N ii] emission lines (Fig. 1c); black dots on eastern side: blue [O ii] ionized gas emission line (Fig. 1e), gray dots on eastern side: blue Hϵ, Hδ stellar absorption lines (Fig. 1f).
Current usage metrics show cumulative count of Article Views (full-text article views including HTML views, PDF and ePub downloads, according to the available data) and Abstracts Views on Vision4Press platform.
Data correspond to usage on the plateform after 2015. The current usage metrics is available 48-96 hours after online publication and is updated daily on week days.
Initial download of the metrics may take a while.


