Fig. 7
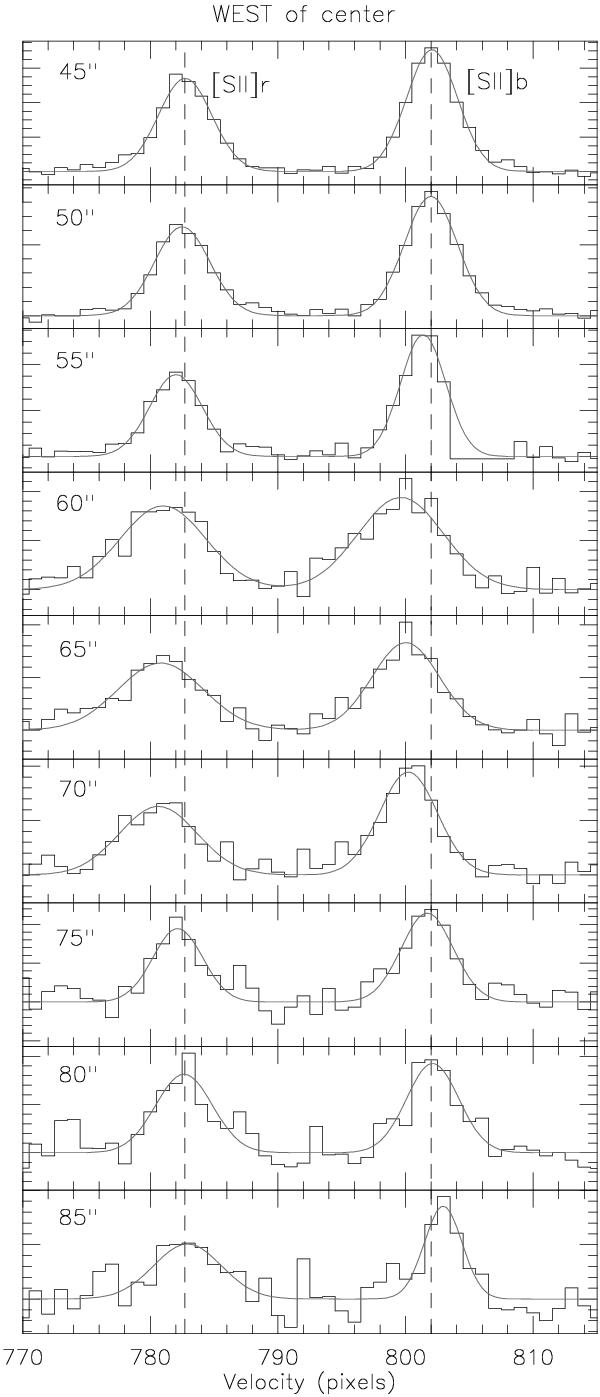
[S ii] 6716 Å (b) and 6731 Å (r) lines and single Gaussian profiles fits to the spectrogram C of Fig. 3. The positions (west) of the profiles are indicated. Two pixels (one tick mark) is 70 km s-1. The vertical dashed lines illustrate the velocity shift; the reversal occurs near 60−70′′. From 45 to 85′′, the line intensity decreases by a facter of ~10, with a corresponding increase in noise. (The FWHM of a weak skyline (near Hα) is 2.5 pixels.)
Current usage metrics show cumulative count of Article Views (full-text article views including HTML views, PDF and ePub downloads, according to the available data) and Abstracts Views on Vision4Press platform.
Data correspond to usage on the plateform after 2015. The current usage metrics is available 48-96 hours after online publication and is updated daily on week days.
Initial download of the metrics may take a while.