Fig. 5
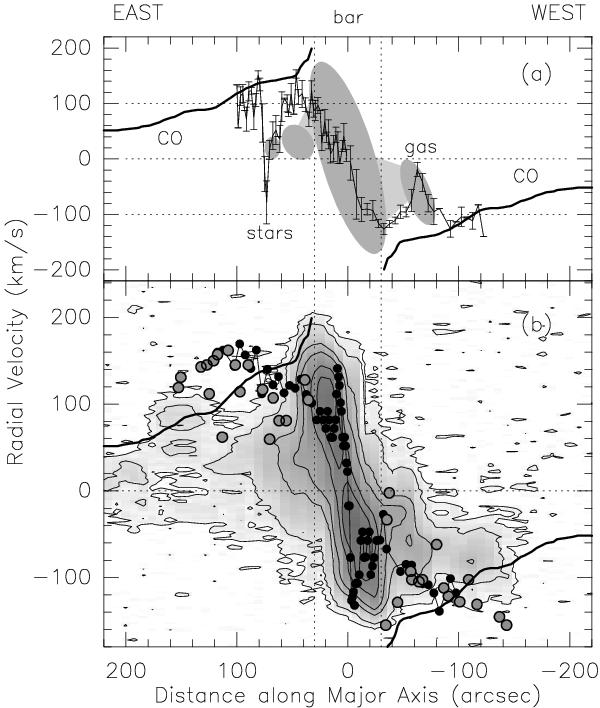
a) Schematic representation of measured 12CO(1–0) radial velocities (from Walter et al. 2002, interferometer measurements). Overlaid on the eastern side: velocity reversal observed in stellar motions (Fig. 1f); western side: velocity reversal observed in [S ii], [N ii] emission lines (Fig. 1c). b) 12CO (2–1) radial velocities (contours at 0.03, 0.1, 0.5, 1, 2.5, 4, and 10 K). Overlaid are radial velocities of stars: black dots (Fig. 1b) and of stellar clusters: open circles (from Konstantopoulos et al. 2009, and Fig. 4b). The line in a) and b) is the smooth 12CO(2–1) radial velocity curve published by Sofue (1998). The IRAM 30-m telescope CO data shown in b) are from Weiß et al. (2009, priv. comm.) [HERA 9-channel receiver, 11′′ beam width].
Current usage metrics show cumulative count of Article Views (full-text article views including HTML views, PDF and ePub downloads, according to the available data) and Abstracts Views on Vision4Press platform.
Data correspond to usage on the plateform after 2015. The current usage metrics is available 48-96 hours after online publication and is updated daily on week days.
Initial download of the metrics may take a while.