Fig. 4
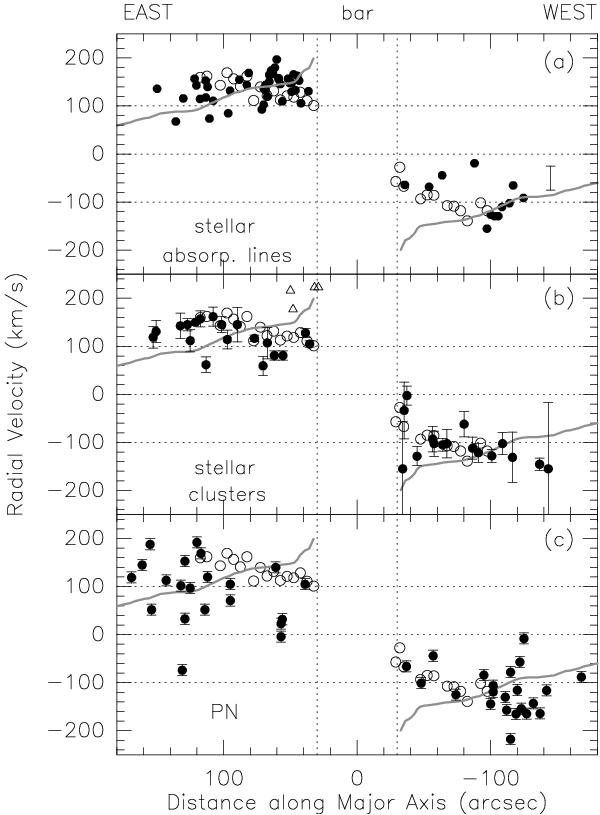
a) Radial velocities of stellar absorption lines in the wavelength region 4700−5450 Å measured by Whitmore et al. (1984): black dots. The bar is the 1σ error of their data. In all panels, the open circles are the radial velocities of the near-IR stellar Ca ii absorption lines shown in Fig. 1b; the continuous lines present the CO radial velocities published by Sofue (1998). b) radial velocities of stellar clusters (within |z| ≲ 500 pc) from Konstantopoulos et al. (2009): black dots, triangles: cluster Nos. 108, 112, 2, 125, 126 with a high radial velocity, seen in the direction of complex B. c) radial velocities of planetary nebulae (within |z| ≲ 500 pc) from Johnson et al. (2009): black dots.
Current usage metrics show cumulative count of Article Views (full-text article views including HTML views, PDF and ePub downloads, according to the available data) and Abstracts Views on Vision4Press platform.
Data correspond to usage on the plateform after 2015. The current usage metrics is available 48-96 hours after online publication and is updated daily on week days.
Initial download of the metrics may take a while.