Fig. 1
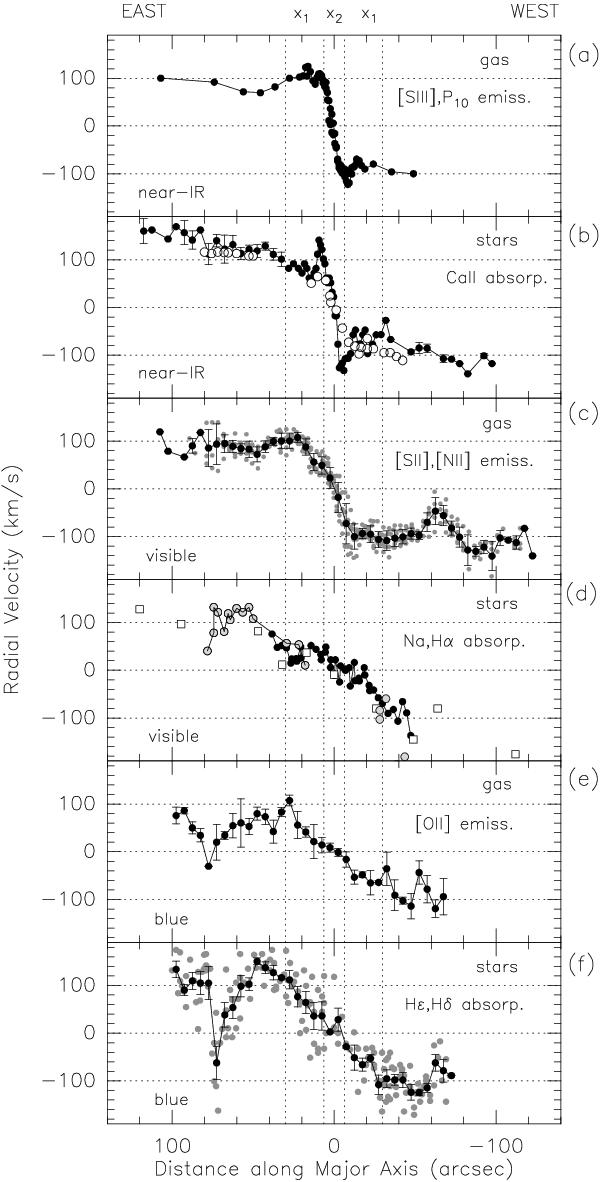
Position-velocity diagram along M 82’s major axis showing the motion of gas and stars; the vertical dashed lines indicate the extent of the bar (x2 and x1-orbits). At the top: measurements at near-IR wavelengths, which probe the center region. At the bottom: measurements at blue wavelengths, which probe the more outer regions. a) From McK93. b) Black dots: from GWNP (10′′ bins); open circles: stellar Ca II measurements by Westmoquette et al. (2009). c) Black dots: average (5′′ bins) of [SII], [NII] emission lines from Fig. 3, A–E, simulating a slit of ~±7′′ width; gray dots: individual measurements. d) Black dots: Na D measurements by Saito et al. (1984); connected gray open circles: Hα absorption line (component C4) measurement by Westmoquette et al. (2009); open squares: absorption line data from Mayall (1960). e), f) From McK93; f) gray dots: individual measurements.
Current usage metrics show cumulative count of Article Views (full-text article views including HTML views, PDF and ePub downloads, according to the available data) and Abstracts Views on Vision4Press platform.
Data correspond to usage on the plateform after 2015. The current usage metrics is available 48-96 hours after online publication and is updated daily on week days.
Initial download of the metrics may take a while.