Fig. 2
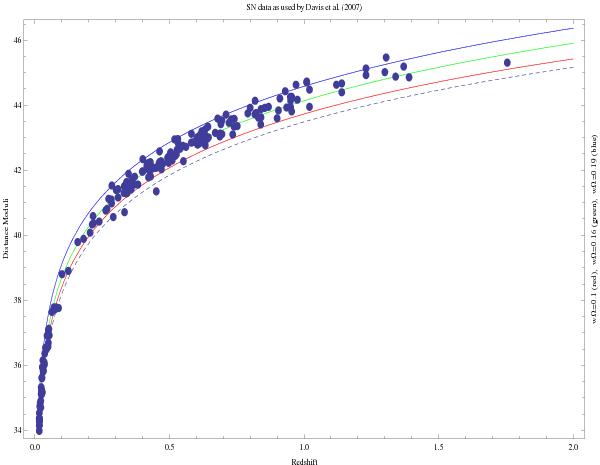
Overplotted in the Hubble diagram of the SN Ia sample used by Davis et al. (2007), are the theoretical curves of the distance modulus in the collisional-DM model, i.e., Eq. (55), for several values of the combination wΩM. Almost the entire dataset lies within the stripe formed by the curves μ(z), corresponding to wΩM = 0.10 (red solid line) and wΩM = 0.19 (blue solid line), while, the best fit to this sample is achieved for wΩM = 0.16 (green line). Once again, the dashed line represents the (incorrectly used) theoretical curve  with
with  being given by Eq. (73).
Current usage metrics show cumulative count of Article Views (full-text article views including HTML views, PDF and ePub downloads, according to the available data) and Abstracts Views on Vision4Press platform.
Data correspond to usage on the plateform after 2015. The current usage metrics is available 48-96 hours after online publication and is updated daily on week days.
Initial download of the metrics may take a while.