Fig. 1
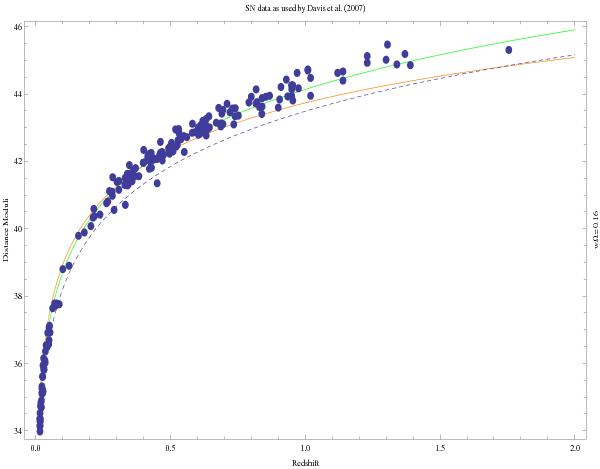
Hubble diagram of the SN Ia sample used by Davis et al. (2007). Overplotted are the theoretical curves, corresponding to the distance moduli: μ(z) for wΩM = 0.16 (green solid line);  (also for wΩM = 0.16) with
  being given by Eq. (72) (orange solid line); and with being given by Eq. (73) (dashed line). We observe that, after the thermodynamical content of a collisional-DM fluid is taken into account, the theoretical curve representing the distance modulus, μ(z) (Eq. (55)), fits the entire dataset quite accurately (green line).
Current usage metrics show cumulative count of Article Views (full-text article views including HTML views, PDF and ePub downloads, according to the available data) and Abstracts Views on Vision4Press platform.
Data correspond to usage on the plateform after 2015. The current usage metrics is available 48-96 hours after online publication and is updated daily on week days.
Initial download of the metrics may take a while.