Fig. 3
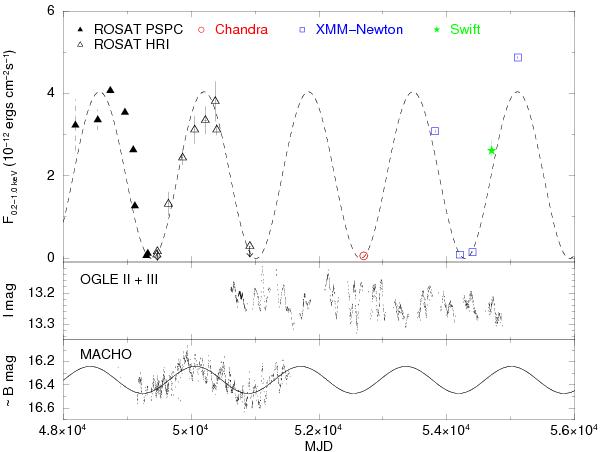
The 0.2−1.0 keV X-ray light curve of SMC 3 (upper panel), the light curves in the I-band (OGLE, middle panel) and the approximate B-band (MACHO, lower panel). The dashed line shows the best-fit sine function to the X-ray light curve and the solid line the best-fit sine function to the MACHO light curve (see text).
Current usage metrics show cumulative count of Article Views (full-text article views including HTML views, PDF and ePub downloads, according to the available data) and Abstracts Views on Vision4Press platform.
Data correspond to usage on the plateform after 2015. The current usage metrics is available 48-96 hours after online publication and is updated daily on week days.
Initial download of the metrics may take a while.