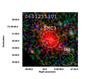
Fig. 1
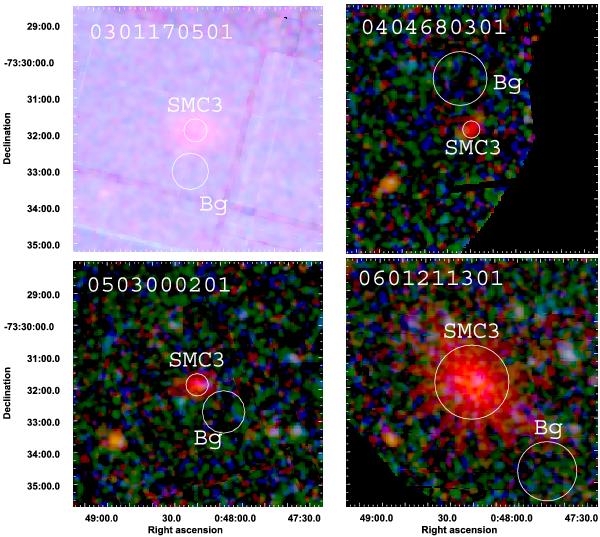
Combined EPIC colour images of SMC 3 from the four XMM-Newton observations. Red, green, and blue colours denote X-ray intensities in the 0.2−1.0, 1.0−2.0 and 2.0−4.5 keV bands. Circles indicate the extraction regions. In the upper left, the background is increased at higher energies.
Current usage metrics show cumulative count of Article Views (full-text article views including HTML views, PDF and ePub downloads, according to the available data) and Abstracts Views on Vision4Press platform.
Data correspond to usage on the plateform after 2015. The current usage metrics is available 48-96 hours after online publication and is updated daily on week days.
Initial download of the metrics may take a while.