Fig. 9
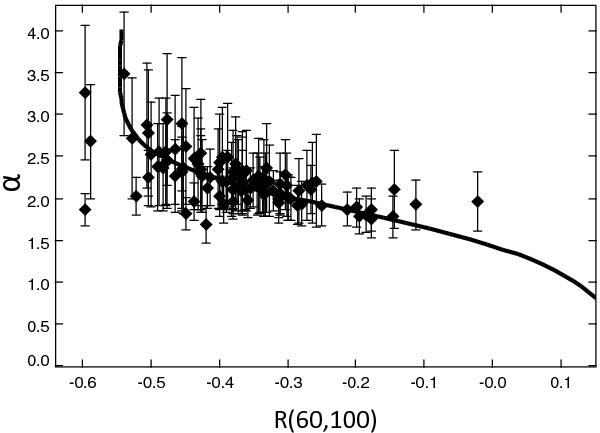
α parameter estimated with CIGALE as a function of the 60 to 100 μm flux ratio, R(60, 100) for galaxies observed at all far-IR wavelengths, up to 160 μm. Vertical error bars represent the standard deviation in the determination of α given by the Bayesian analysis. The relation between α and R(60, 100) for the DH02 models is plotted as a solid line.
Current usage metrics show cumulative count of Article Views (full-text article views including HTML views, PDF and ePub downloads, according to the available data) and Abstracts Views on Vision4Press platform.
Data correspond to usage on the plateform after 2015. The current usage metrics is available 48-96 hours after online publication and is updated daily on week days.
Initial download of the metrics may take a while.