Free Access
Fig. 6
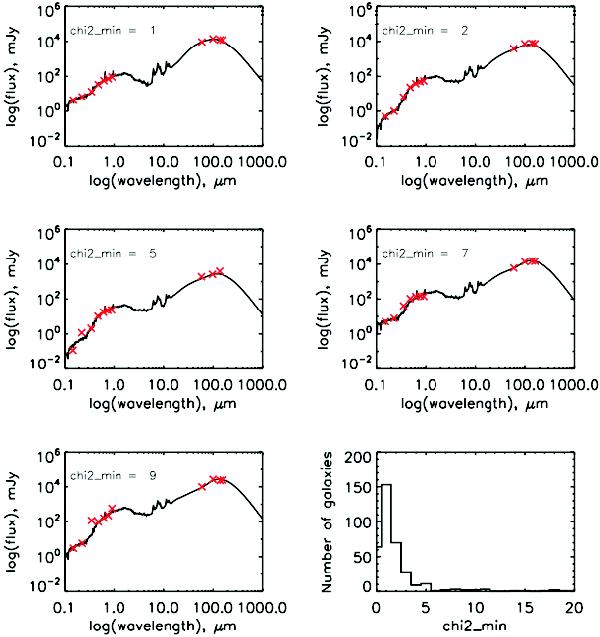
Five examples of best-fit models with different reduced χ2 minima chosen to be representative of our sample. The observed data are plotted with red crosses and the best-fit model with a solid line. The distribution of the reduced χ2 minima for the entire sample is plotted in the last panel.
Current usage metrics show cumulative count of Article Views (full-text article views including HTML views, PDF and ePub downloads, according to the available data) and Abstracts Views on Vision4Press platform.
Data correspond to usage on the plateform after 2015. The current usage metrics is available 48-96 hours after online publication and is updated daily on week days.
Initial download of the metrics may take a while.