Fig. 5
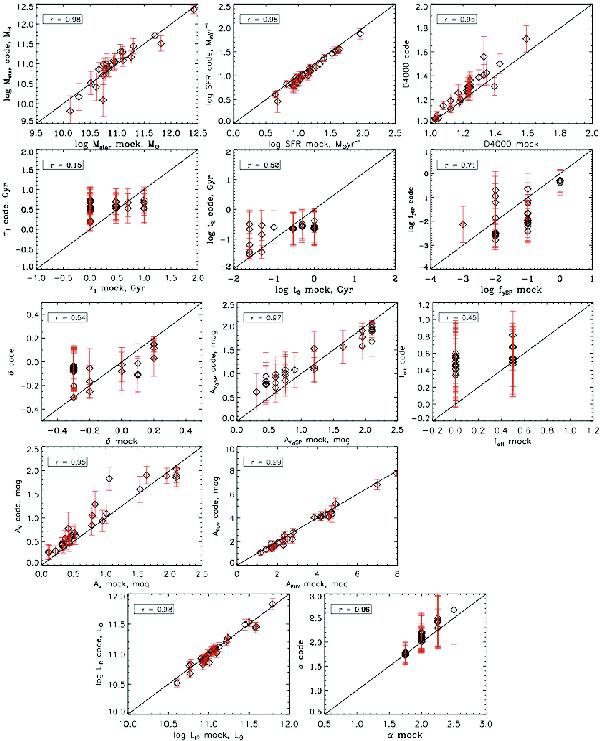
Results of Bayesian analysis of the mock catalog. Each plot corresponds to an output parameter considered in this work and discussed in the text. The first six output parameters are related to the star formation history (Mstar, SFR, D4000, τ1, t2, and fySP); the next five output parameters characterize the dust attenuation (δ, AV,ySP, fatt, AV, and AFUV) and the two last ones define the IR dust emission (LIR and α). The “exact” values are plotted on the x-axis, the results applying the SED fitting method to the mock data are plotted on the y-axis, and the standard error given by the Bayesian analysis is over plotted as an error bar for each value. The linear Pearson correlation coefficient (r) is indicated on each plot.
Current usage metrics show cumulative count of Article Views (full-text article views including HTML views, PDF and ePub downloads, according to the available data) and Abstracts Views on Vision4Press platform.
Data correspond to usage on the plateform after 2015. The current usage metrics is available 48-96 hours after online publication and is updated daily on week days.
Initial download of the metrics may take a while.