Free Access
Fig. 17
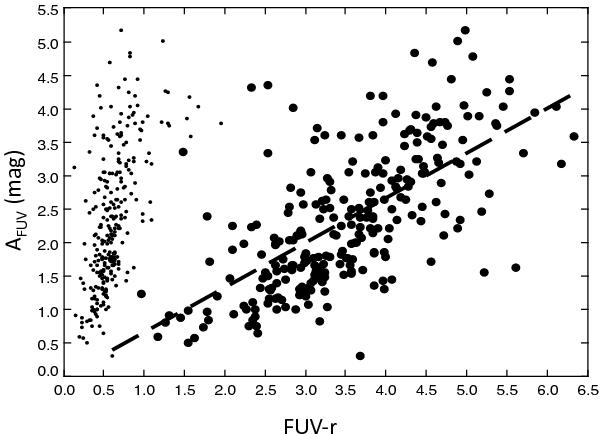
AFUV plotted against FUV − r. The sample is restricted to 265 galaxies with an error in FUV − r that is smaller than 0.2 mag, the linear regression is plotted as a dashed line. The small dots correspond to FUV − NUV reported on the x-axis (similar to Fig. 16) and are overplotted here for comparison (see text for details).
Current usage metrics show cumulative count of Article Views (full-text article views including HTML views, PDF and ePub downloads, according to the available data) and Abstracts Views on Vision4Press platform.
Data correspond to usage on the plateform after 2015. The current usage metrics is available 48-96 hours after online publication and is updated daily on week days.
Initial download of the metrics may take a while.