Fig. 16
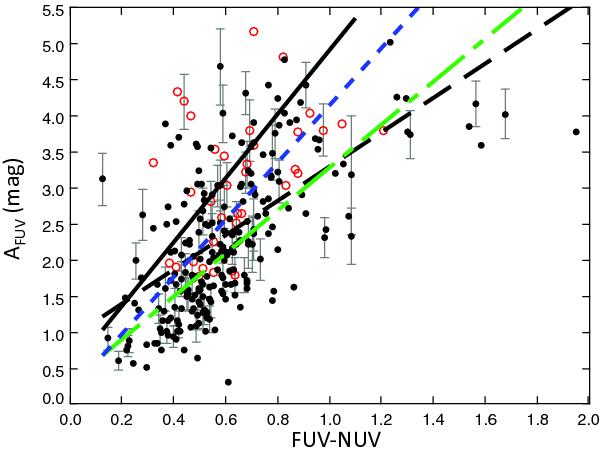
AFUV plotted against FUV − NUV. The sample is restricted to 267 galaxies with an error in FUV − NUV lower than 0.2 mag, and the linear regression is plotted as a dashed black line. Galaxies with LIR > 1011 L⊙ are plotted as empty red circles. Relations from previous studies are overplotted: Salim et al. (2007) (green dot-dashed line), Seibert et al. (2005) (blue dotted line), and Meurer et al. (1999) (black solid line). Standard errors in AFUV are plotted for 1/4 of the objects.
Current usage metrics show cumulative count of Article Views (full-text article views including HTML views, PDF and ePub downloads, according to the available data) and Abstracts Views on Vision4Press platform.
Data correspond to usage on the plateform after 2015. The current usage metrics is available 48-96 hours after online publication and is updated daily on week days.
Initial download of the metrics may take a while.