Fig. 15
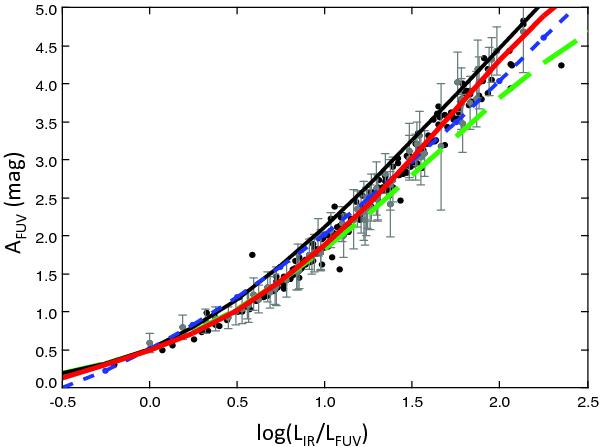
AFUV plotted as a function of LIR/LFUV, the result of the polynomial regression being plotted as a red thick solid line. Models from Meurer et al. (1999) (black thin solid line), Buat et al. (2005) (blue dotted line), and Cortese et al. (2008) with τ = 6.2 Gyr (green dashed line) are overplotted. Standard errors in AFUV are plotted for 1/4 of the objects.
Current usage metrics show cumulative count of Article Views (full-text article views including HTML views, PDF and ePub downloads, according to the available data) and Abstracts Views on Vision4Press platform.
Data correspond to usage on the plateform after 2015. The current usage metrics is available 48-96 hours after online publication and is updated daily on week days.
Initial download of the metrics may take a while.