Fig. 13
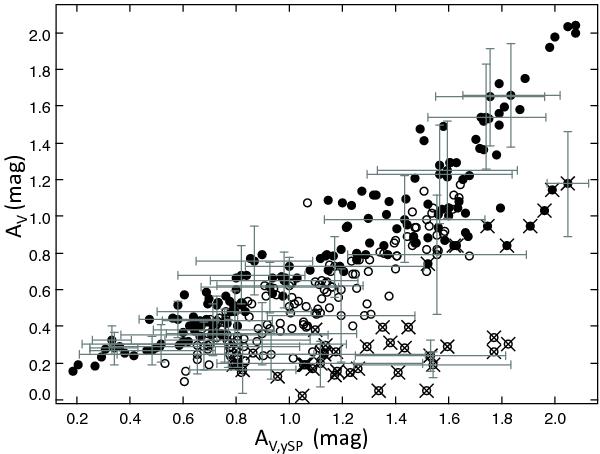
V-band attenuation, AV, plotted against V-band attenuation of the young stellar population alone, AV,ySP. Filled symbols are for galaxies with D4000 < 1.3 and empty ones for objects with D4000 > 1.3. Standard deviations are plotted as error bars for 1/4 of the sample. Crosses are over-plotted on symbols corresponding to galaxies with fatt < 0.2.
Current usage metrics show cumulative count of Article Views (full-text article views including HTML views, PDF and ePub downloads, according to the available data) and Abstracts Views on Vision4Press platform.
Data correspond to usage on the plateform after 2015. The current usage metrics is available 48-96 hours after online publication and is updated daily on week days.
Initial download of the metrics may take a while.