Fig. 1
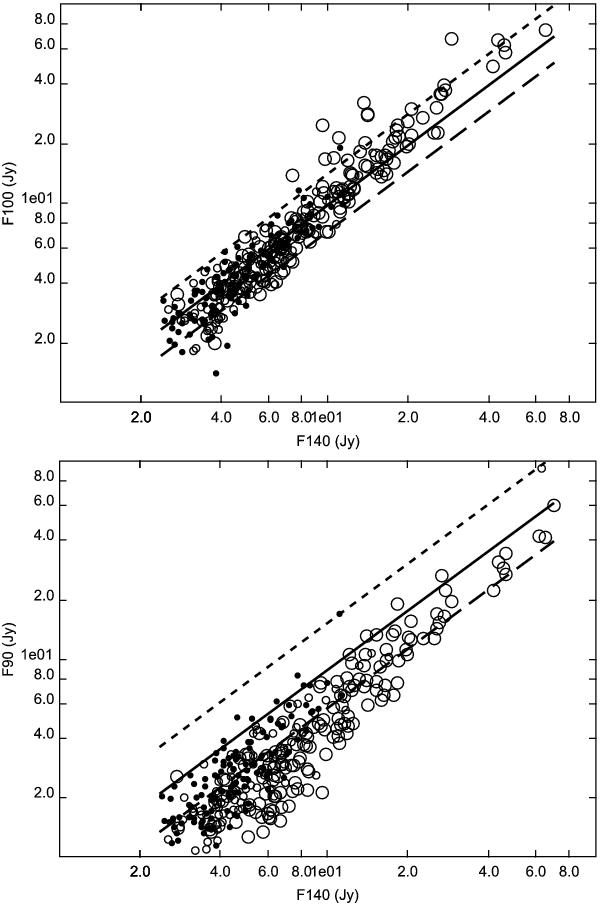
AKARI fluxes at 140 μm plotted against IRAS fluxes at 100 μm (upper panel) and AKARI fluxes at 90 μm (lower panel). The sample is divided into three sub-samples according to the diameter d of the galaxies: d < 1′ (dots), 1′ < d < 1.5′ (small circles), and d > 1.5′ (large circles). The data are compared to model predictions from Dale & Helou (2002) for three different values of the α parameter, α = 1.5,2, and 2.5 (dotted, solid, and dashed lines respectively).
Current usage metrics show cumulative count of Article Views (full-text article views including HTML views, PDF and ePub downloads, according to the available data) and Abstracts Views on Vision4Press platform.
Data correspond to usage on the plateform after 2015. The current usage metrics is available 48-96 hours after online publication and is updated daily on week days.
Initial download of the metrics may take a while.