Free Access
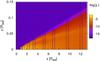
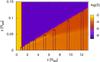
Fig. 4

Opacity and source function in the disc model of an AM CVn system. The values are plotted for the centre of the HeI 4923 Å line. Rectangles denote values obtained using the AcDc code. To illustrate the disc geometry, the white dwarf is depicted here (yellow “rectangle” in the right graph).
This figure is made of several images, please see below:
Current usage metrics show cumulative count of Article Views (full-text article views including HTML views, PDF and ePub downloads, according to the available data) and Abstracts Views on Vision4Press platform.
Data correspond to usage on the plateform after 2015. The current usage metrics is available 48-96 hours after online publication and is updated daily on week days.
Initial download of the metrics may take a while.