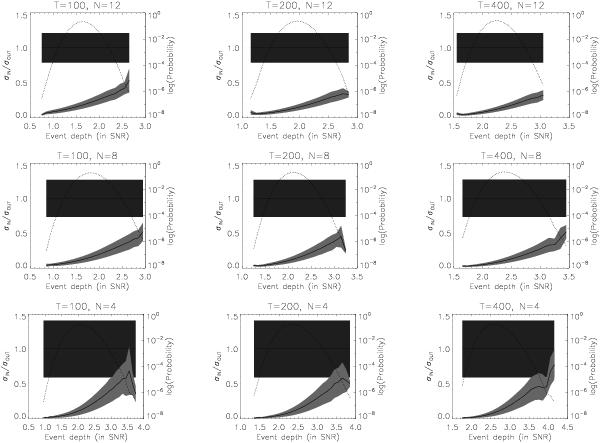
Fig. 5

The variance of the variance of the in-transit observations: Gaussian outliers vs. true transits. These figures show how the variance of the presumed in-transit observations varies depending on total number of observations (T), number of in-transit observations (N) and event depth in S/N ratio for true transits or a collection of Gaussian outliers. The dark gray region defines the 1σ range of the possible sample variances of true in-transit observations, while the light gray region define a similar range for presumed in-transit observations that are actually Guassian outliers, with the solid lines marking the center of these distributions. The dotted line marks the probability that a “false positive” transit of the specified depth by N Gaussian outliers out of a sample of T observations could be randomly generated. As an example, let us assume that a transit with a depth corresponding to a signal-to-noise ratio of 2.5, comprised of 12 in-transit obervations out of 200 total observations. The σrms of the out-of-transit observations and the in-transit observations is then calculated and compared (σin/σout). Looking at the appropropriate plot, we can see that a value higher than 0.5 or so is highly unlikely to be caused by chance collection of statistical outliers based simply on the distribution of the fluxes of the observations, without regard to periodicity.
Current usage metrics show cumulative count of Article Views (full-text article views including HTML views, PDF and ePub downloads, according to the available data) and Abstracts Views on Vision4Press platform.
Data correspond to usage on the plateform after 2015. The current usage metrics is available 48-96 hours after online publication and is updated daily on week days.
Initial download of the metrics may take a while.


