Fig. 3
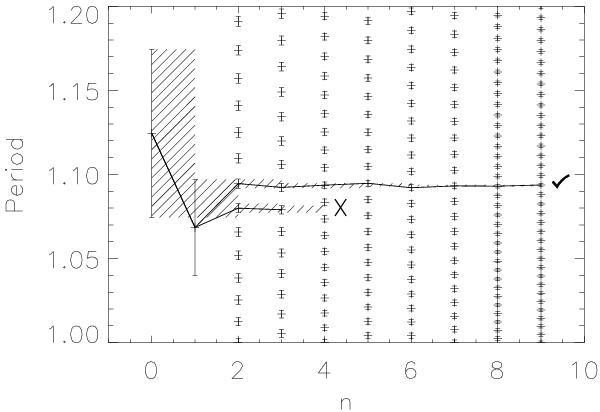
Temporal difference between observations, zoom. This figure is the same as above, but focused on the solution, with the crosshatched region showing the constraints on the period above and beyond the limit bars. Here, one can see an example of a branch in the possibilities at Δ1, as two possible periods from Δ2 fall within the period range described by Δ1. This is a relatively common occurrence, so the code has been designed to follow all possibilities should a branching occur.
Current usage metrics show cumulative count of Article Views (full-text article views including HTML views, PDF and ePub downloads, according to the available data) and Abstracts Views on Vision4Press platform.
Data correspond to usage on the plateform after 2015. The current usage metrics is available 48-96 hours after online publication and is updated daily on week days.
Initial download of the metrics may take a while.