Fig. 2
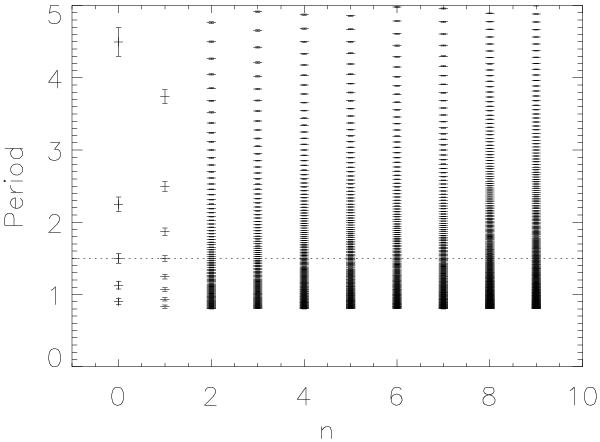
Example of temporal difference between observations. This figure shows the temporal differences between a set of 5 in-transit observations with the associated allowed period ranges based on the test duration D and the transit number m depicted as error bars. The true period is 1.1 days, marked by the dotted line, and the test duration is 0.2 days. The size of the temporal differences (Δn) increases from left to right. Notice how the period ranges narrow during this progression, due to the increasing transit number. By testing the periods defined by the smallest temporal difference (Δ0), which has the smallest n and therefore fewer possible periods, then the same for the next-smallest temporal difference (Δ1), etc., we can most efficiently converge on the best period. The Δns in this case are 4.4979, 7.4797, 80.9989, 88.4786, 117.0229, 121.5207, 124.50251, 129.0004, 205.5014, and 209.9993. The corresponding values of m that yield the correct period are 4, 7, 75, 81, 107, 111, 114, 118, 188, and 192.
Current usage metrics show cumulative count of Article Views (full-text article views including HTML views, PDF and ePub downloads, according to the available data) and Abstracts Views on Vision4Press platform.
Data correspond to usage on the plateform after 2015. The current usage metrics is available 48-96 hours after online publication and is updated daily on week days.
Initial download of the metrics may take a while.