Fig. 5
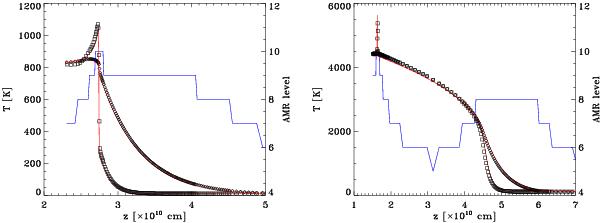
Left: temperature profiles for a subcritical shock with piston velocity v = 6 km s-1, at time t = 3.8 × 10⁴ s. Right: temperature profiles for a supercritical shock with piston velocity v = 20 km s-1, at time t = 7.5 × 10³ s. In both cases, the temperatures are displayed as a function of z = x − vt. The squares represent the gas temperature and the diamonds the radiative temperature. The red curves represent the gas and radiative temperatures obtained with a calculation using 2048 cells, which we take as the “exact” solution. The AMR levels (blue line – right axis) are overplotted.
Current usage metrics show cumulative count of Article Views (full-text article views including HTML views, PDF and ePub downloads, according to the available data) and Abstracts Views on Vision4Press platform.
Data correspond to usage on the plateform after 2015. The current usage metrics is available 48-96 hours after online publication and is updated daily on week days.
Initial download of the metrics may take a while.