Fig. 9
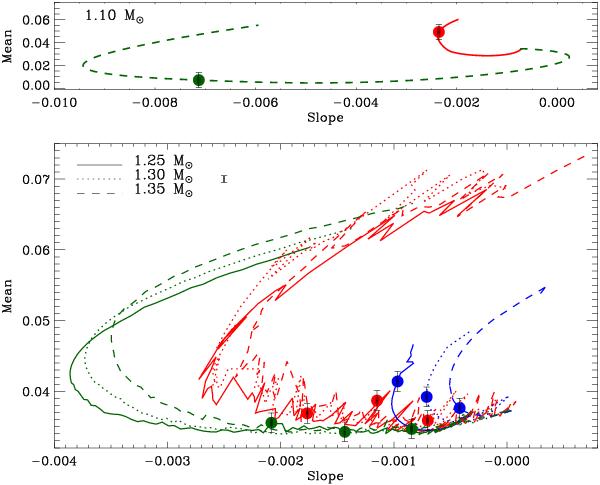
Slope versus mean value diagram of the frequency ratios in the assumed observable range throughout the main sequence evolution. Top panel: 1.1 M⊙ models without overshooting (solid red line) and with overshooting (dashed green line). Bottom panel: different mass values for the three considered mixing prescriptions: Ledoux (blue), Schwarzschild (red), and Overshooting (green). A representative 1-σ error bar is plotted at the top left. Models marked with a filled circle have the same value of the large frequency separation, and error bars correspond to 3-σ uncertainties in the frequencies. See text for details.
Current usage metrics show cumulative count of Article Views (full-text article views including HTML views, PDF and ePub downloads, according to the available data) and Abstracts Views on Vision4Press platform.
Data correspond to usage on the plateform after 2015. The current usage metrics is available 48-96 hours after online publication and is updated daily on week days.
Initial download of the metrics may take a while.