Fig. 7
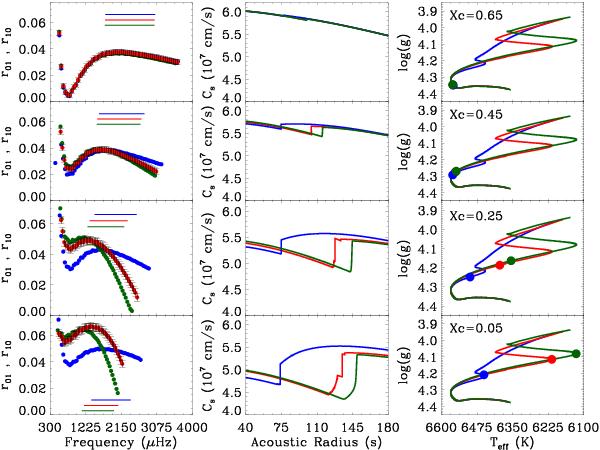
Comparison for 1.3 M⊙ models using different mixing prescriptions: Ledoux (blue), Schwarzschild (red) and overshooting (green). Each row of models represents a value of the central hydrogen content (from top to bottom): Xc = 0.65, Xc = 0.45, Xc = 0.25, and Xc = 0.05. Left panels: frequency ratios as defined in Eq. (14). Horizontal lines show a typical observable frequency range for each mixing prescription of radial orders n = 15–27. Central panels: adiabatic sound speed showing the position of the density discontinuity. Right panels: evolutionary tracks for the three selected prescriptions, and the position of the studied models is represented by a filled circle. Error bars have been plotted for reference in the models computed with the Schwarzschild criterion.
Current usage metrics show cumulative count of Article Views (full-text article views including HTML views, PDF and ePub downloads, according to the available data) and Abstracts Views on Vision4Press platform.
Data correspond to usage on the plateform after 2015. The current usage metrics is available 48-96 hours after online publication and is updated daily on week days.
Initial download of the metrics may take a while.