Fig. 6
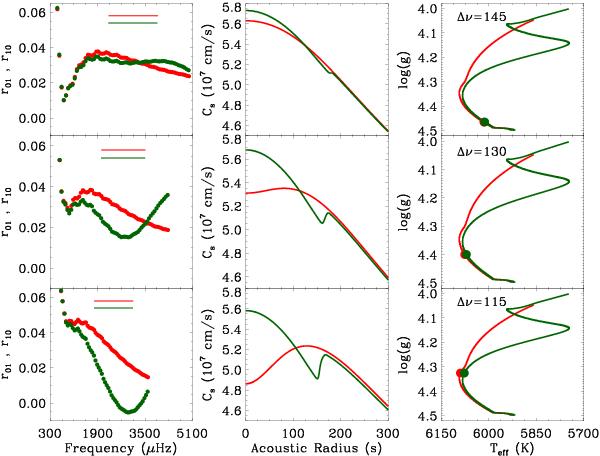
1.1 M⊙ models with a convective core (green) and without one (red). Each row depicts models sharing the same large frequency separation. Left panels: frequency ratios as defined in Eq. (14). Horizontal lines show a typical observable frequency range for each mixing prescription of radial orders n = 15–27. Central panels: adiabatic sound speed as a function of the acoustic radius. Right panels: evolutionary tracks for the two cases considered, the position of the studied models being represented by a filled circle. Values of the selected large frequency separations are given (in μHz).
Current usage metrics show cumulative count of Article Views (full-text article views including HTML views, PDF and ePub downloads, according to the available data) and Abstracts Views on Vision4Press platform.
Data correspond to usage on the plateform after 2015. The current usage metrics is available 48-96 hours after online publication and is updated daily on week days.
Initial download of the metrics may take a while.