Fig. 3
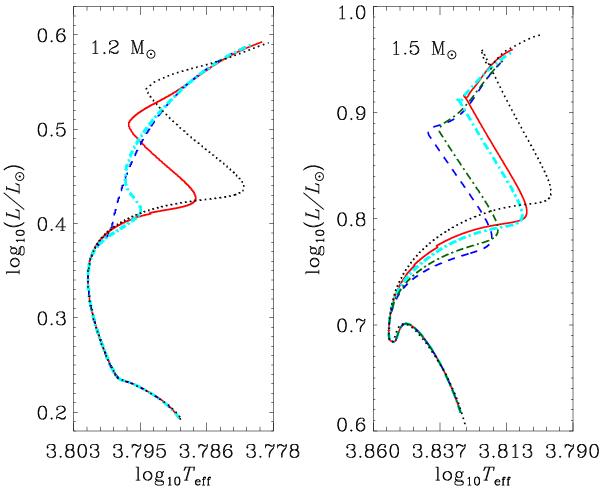
Hertzprung-Russell diagram for 1.2 M⊙ (left panel) and 1.5 M⊙ (right panel) models. Computations with the Ledoux criterion and no mixing in the semiconvective regions are plotted with dashed blue lines, Schwarzschild criterion with solid red lines, and dotted black lines correspond to tracks with Schwarzschild criterion and overshooting. Two values for the semiconvective efficiency αsc are also plotted in thin green dash-dotted line (αsc = 0.001; not shown for the 1.2 M⊙ as it overlaps with the dashed track) and thick light blue dash-dotted line (αsc = 0.01). The tracks span the evolution from the Zero-Age main sequence until hydrogen exhaustion in the core.
Current usage metrics show cumulative count of Article Views (full-text article views including HTML views, PDF and ePub downloads, according to the available data) and Abstracts Views on Vision4Press platform.
Data correspond to usage on the plateform after 2015. The current usage metrics is available 48-96 hours after online publication and is updated daily on week days.
Initial download of the metrics may take a while.