Fig. 1
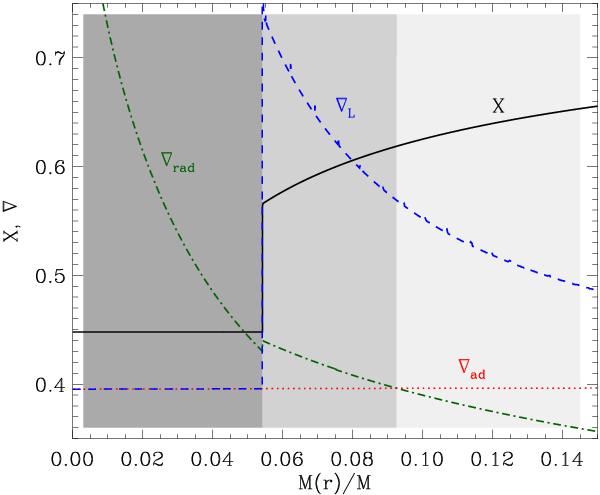
Internal structure of a 1.5 M⊙ stellar model in the main sequence. The hydrogen abundance profile X (black solid line), the adiabatic gradient ∇ad (red dotted line), the radiative gradient ∇rad (green dash-dotted line), and the Ledoux gradient ∇L (blue dashed line) are plotted as functions of the mass fraction. From left to right, tones of gray fill regions of different energy transport processes: convective zone, semiconvective zone, and radiative zone.
Current usage metrics show cumulative count of Article Views (full-text article views including HTML views, PDF and ePub downloads, according to the available data) and Abstracts Views on Vision4Press platform.
Data correspond to usage on the plateform after 2015. The current usage metrics is available 48-96 hours after online publication and is updated daily on week days.
Initial download of the metrics may take a while.