Free Access
Fig. 6
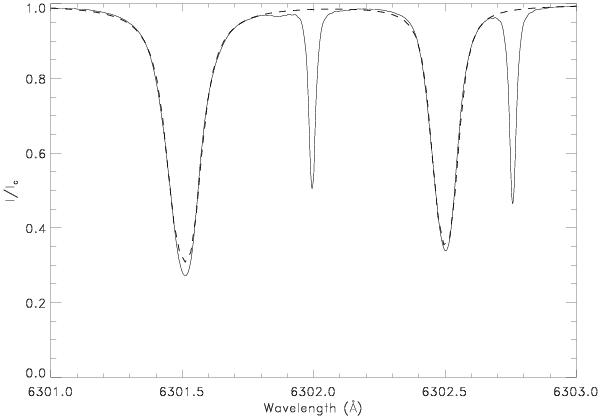
FTS atlas intensity spectrum (solid) and average profile synthesized from the 3D model (dashed) without instrumental profile (i.e., with very high spectral resolution). The lines at 6302.00 and 6302.76 Å are telluric lines (absent in the Hinode data). Spectra are normalized to the continuum intensity (Ic).
Current usage metrics show cumulative count of Article Views (full-text article views including HTML views, PDF and ePub downloads, according to the available data) and Abstracts Views on Vision4Press platform.
Data correspond to usage on the plateform after 2015. The current usage metrics is available 48-96 hours after online publication and is updated daily on week days.
Initial download of the metrics may take a while.