Free Access
Fig. 2
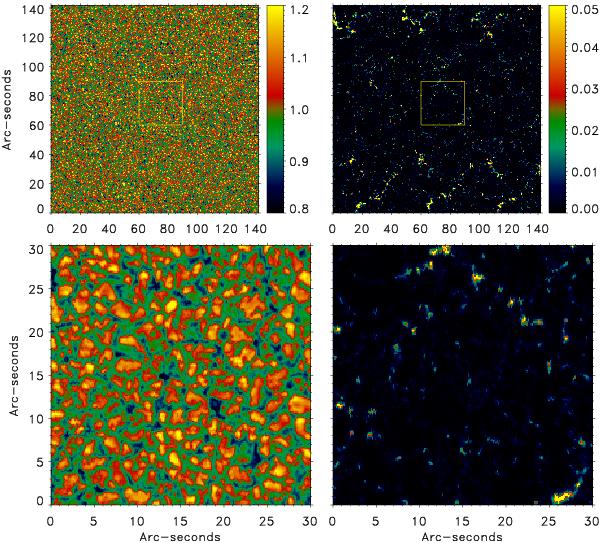
Full field of view (upper panels) and subfield selected for inversions (lower panels). Left: continuum image. Right: synthetic magnetogram, saturated at 5% of the average continuum intensity. The selected subfield avoids some flatfield artifacts that are visible as horizontal segments in the upper left panel.
Current usage metrics show cumulative count of Article Views (full-text article views including HTML views, PDF and ePub downloads, according to the available data) and Abstracts Views on Vision4Press platform.
Data correspond to usage on the plateform after 2015. The current usage metrics is available 48-96 hours after online publication and is updated daily on week days.
Initial download of the metrics may take a while.