Free Access
Fig. 11
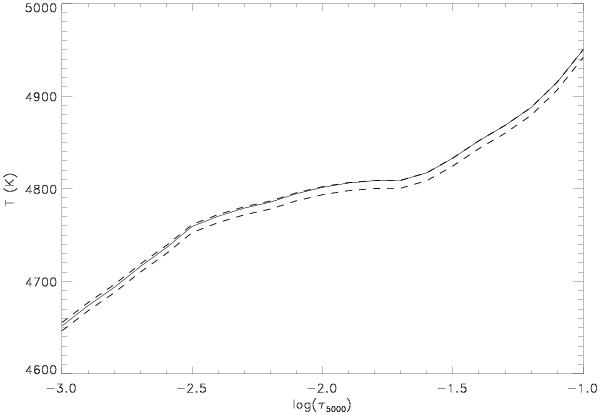
Models obtained when inverting the synthetic average spectrum with different values of the Fe abundance. The solid line is for the reference value of 7.50. The dashed lines are for 7.40 (lower curve) and 7.60 (upper curve).
Current usage metrics show cumulative count of Article Views (full-text article views including HTML views, PDF and ePub downloads, according to the available data) and Abstracts Views on Vision4Press platform.
Data correspond to usage on the plateform after 2015. The current usage metrics is available 48-96 hours after online publication and is updated daily on week days.
Initial download of the metrics may take a while.