Free Access
Fig. 6
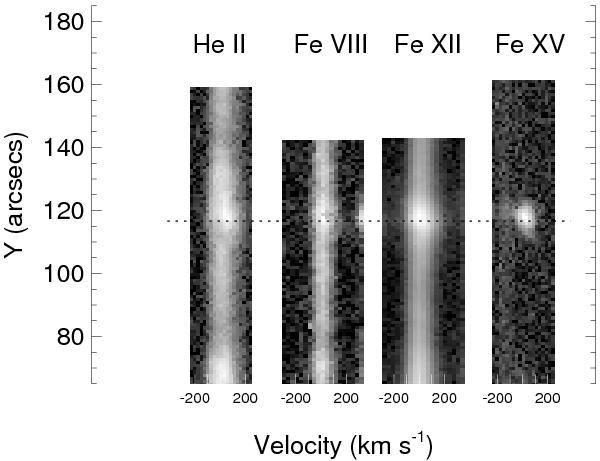
Spectra in He ii λ25.632 nm, Fe viii λ18.660 nm, Fe xii λ19.512 nm, and Fe xv λ28.416 nm recorded across the microflare QR1 at its peak emission time. The horizontal axis shows Doppler velocity relative to the line center position. Dashed line marks the location of the microflare.
Current usage metrics show cumulative count of Article Views (full-text article views including HTML views, PDF and ePub downloads, according to the available data) and Abstracts Views on Vision4Press platform.
Data correspond to usage on the plateform after 2015. The current usage metrics is available 48-96 hours after online publication and is updated daily on week days.
Initial download of the metrics may take a while.