Free Access
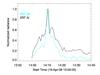
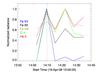
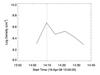
Fig. 3
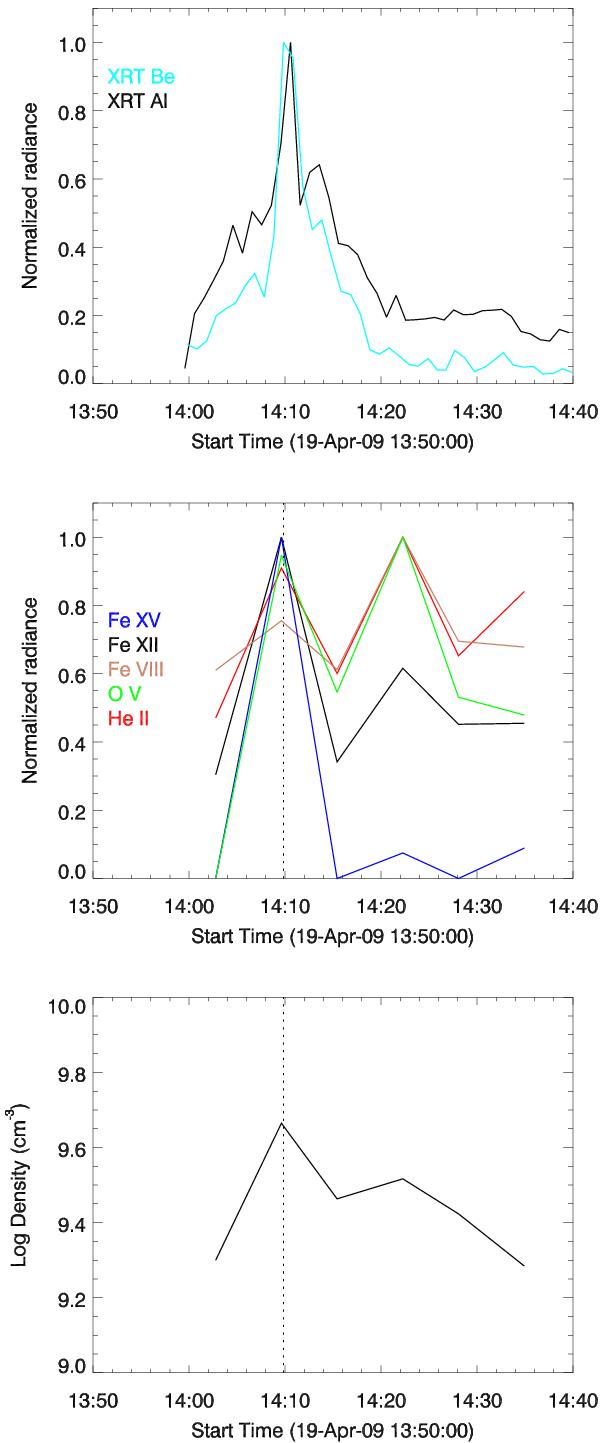
Normalized lightcurves of the microflare in a quiet region (QR1). Top: X-ray lightcurves from XRT Be_thin and Al_poly filters. Middle: lightcurves from EIS emission lines. Bottom: the electron density (cm-3) deduced from the emission ratio of Fe xii λ18.688 nm/λ19.512 nm.
This figure is made of several images, please see below:
Current usage metrics show cumulative count of Article Views (full-text article views including HTML views, PDF and ePub downloads, according to the available data) and Abstracts Views on Vision4Press platform.
Data correspond to usage on the plateform after 2015. The current usage metrics is available 48-96 hours after online publication and is updated daily on week days.
Initial download of the metrics may take a while.