Fig. 1
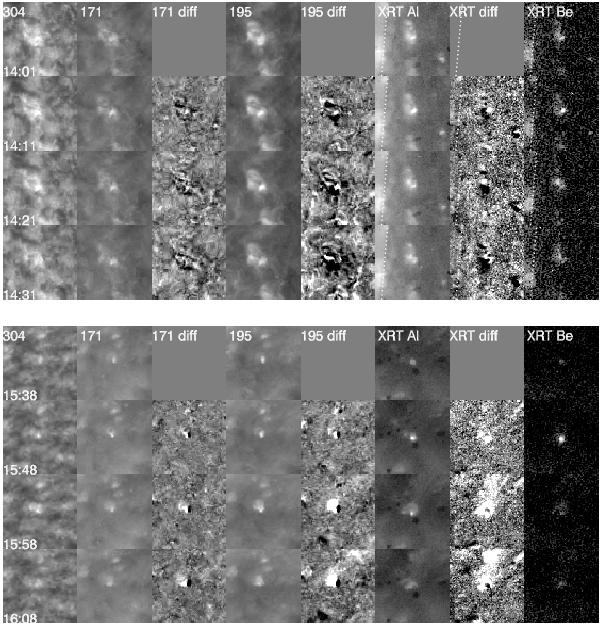
Top: temporal evolution of a bright point in a quiet region (QR1). Columns display time series of SECCHI/EUVI images in λ30.4 nm (He ii), λ17.1 nm (Fe ix/x), and λ19.5 nm (Fe xii) and XRT images with Al_poly and Be_thin filters with 10 min intervals. Difference images are indicated by “diff” on columns. Dimension of the each panel is 100″ × 100″. Dotted lines on the XRT images mark the solar limb. Bottom: temporal evolution of a bright point in a coronal hole (CH1).
Current usage metrics show cumulative count of Article Views (full-text article views including HTML views, PDF and ePub downloads, according to the available data) and Abstracts Views on Vision4Press platform.
Data correspond to usage on the plateform after 2015. The current usage metrics is available 48-96 hours after online publication and is updated daily on week days.
Initial download of the metrics may take a while.