Fig. 4
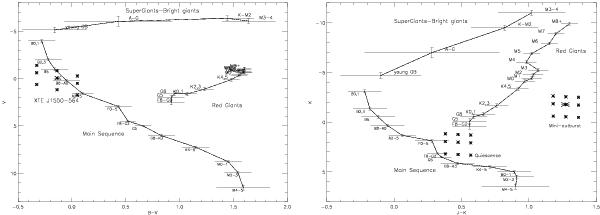
CMDs with characteristic absolute magnitudes of various spectral types, on which we overplot our optical and NIR data (left and right plot respectively) for XTEJ1550-564 during the 2003 mini-outburst; the nine asterisks represent the position of XTEJ1550-564 counterpart, taking into account the uncertainties on its distance and column density. The bigger central asterisk indicates its position using the best fitted distance and column density. In the NIR CMD we also add XTEJ1550-564 position corresponding to quiescence, using magnitudes from this paper and Orosz et al. (2011).
Current usage metrics show cumulative count of Article Views (full-text article views including HTML views, PDF and ePub downloads, according to the available data) and Abstracts Views on Vision4Press platform.
Data correspond to usage on the plateform after 2015. The current usage metrics is available 48-96 hours after online publication and is updated daily on week days.
Initial download of the metrics may take a while.