Fig. 3
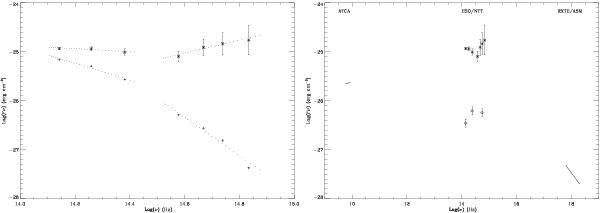
XTEJ1550-564 SEDs during the 2003 mini-outburst. Left: comparison between reddened (crosses in the lower part) and dereddened (asterisks in the upper part) optical/NIR SEDs. From optical (right) to IR (left): BVRI JHKs points. The error bars are also shown and are bigger in the case of the dereddened points owing to the 1.6σ uncertainty on the NH and then on Av (see Sect. 3.1). We also show here power law slopes, with spectral indices given in the text. Right: broadband SED. Our ESO/NTT observations taken during the mini-outburst are shown with asterisk symbols, and the data taken during quiescence (Ks flux obtained during our polarimetric run, J and V flux from Orosz et al.2011) are shown with lozenges. All these data are dereddened with AV = 4.92 mag, and the error bars show the uncertainty on the column density. We also plot the simultaneous X-ray flux/spectrum (Aref’ev et al. 2004), and the ATCA radio fluxes observed during the 2002 outburst, with similar X-ray flux.
Current usage metrics show cumulative count of Article Views (full-text article views including HTML views, PDF and ePub downloads, according to the available data) and Abstracts Views on Vision4Press platform.
Data correspond to usage on the plateform after 2015. The current usage metrics is available 48-96 hours after online publication and is updated daily on week days.
Initial download of the metrics may take a while.