Fig. 2
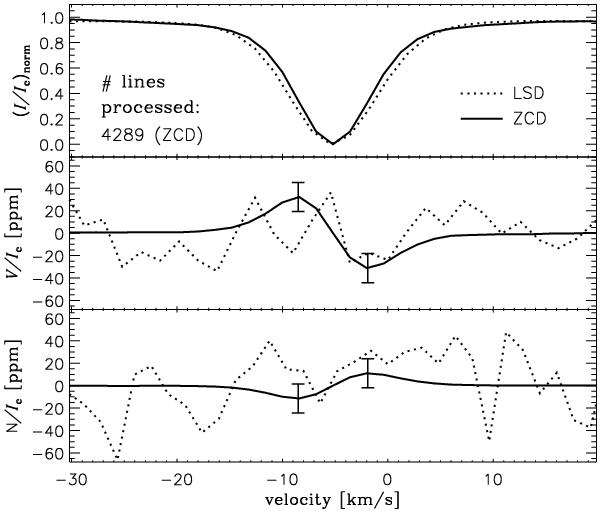
The recovered ZCD line-to-continuum opacity profile, transformed into a mean Stokes I profile with central depth equal to unity (upper panel), mean Stokes V profile (middle panel), and the diagnostic null spectrum (lower panel), all drawn as solid lines. The error bars were estimated with Monte Carlo simulations. Superimposed as dotted lines are the corresponding mean profiles obtained with the LSD technique.
Current usage metrics show cumulative count of Article Views (full-text article views including HTML views, PDF and ePub downloads, according to the available data) and Abstracts Views on Vision4Press platform.
Data correspond to usage on the plateform after 2015. The current usage metrics is available 48-96 hours after online publication and is updated daily on week days.
Initial download of the metrics may take a while.