Free Access
Fig. 8
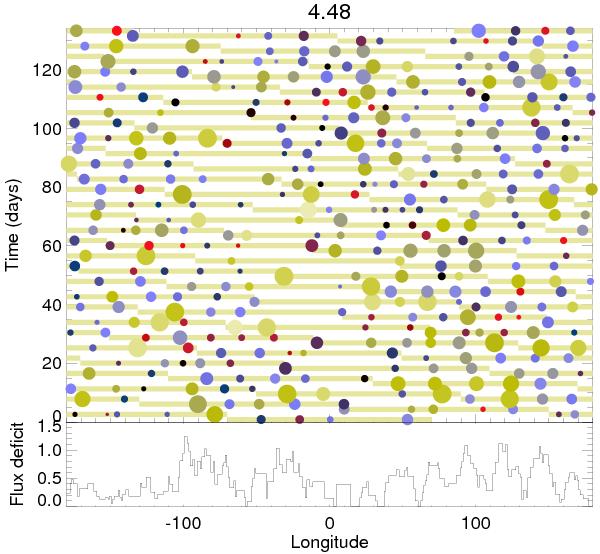
Surface map (top) for spots with flux deficit larger than 0.02 and time integrated flux deficit of the spots versus longitude (bottom) for a stellar rotation period of 4.48 days. The light grey bands in the background of the top panels represent the stellar longitudes visible to the observer.
Current usage metrics show cumulative count of Article Views (full-text article views including HTML views, PDF and ePub downloads, according to the available data) and Abstracts Views on Vision4Press platform.
Data correspond to usage on the plateform after 2015. The current usage metrics is available 48-96 hours after online publication and is updated daily on week days.
Initial download of the metrics may take a while.